Genre: eLearning | MP4 | Video: h264, 1280x720 | Audio: AAC, 44.1 KHz
Language: English | Size: 2.53 GB | Duration: 6h 23m
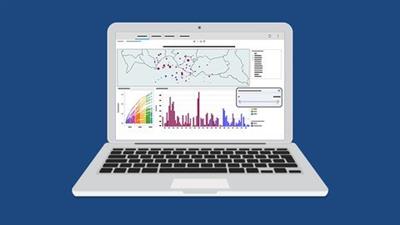
Learn to create stunning visualizations in Tableau Desktop
What you'll learn
What Tableau is and the product suite
The Tableau interface and its major functions
Which data structures are suitable for Tableau
How Tableau reads and categorizes data
How to connect and manage data sources in Tableau
How to build a view and different chart types in Tableau
How to create a dashboard in Tableau
How to publish and share a workbook
How to use numeric, string, conditional, and analytical expressions/functions in Tableau
How to use calculated fields in Tableau
Description
Tableau is one of the best data analytics and business intelligence tools available. In this course, we introduce you to this powerful, market-leading tool and get you started building your very own visualizations.
Move at your own pace as you learn how to navigate Tableau, connect to data sources, and make use of the drag-and-drop interface to create interactive charts and dashboards. We'll cover everything from understanding business intelligence and basic data concepts to applying your own calculations, expressions, and functions in Tableau.
As you progress through the course we'll have you testing your Tableau skills with a series of Tableau exercises and challenges.
Please note that this course focuses on Tableau Desktop and is aimed at people brand new to Tableau or people transitioning from Excel to Tableau.
In this course, you will learn:
What Tableau is and the product suite
What business intelligence is
The Tableau interface and its major functions
Which data structures are suitable for Tableau
How Tableau reads and categorizes data
Different data concepts and theory
How to connect and manage data sources in Tableau
How to navigate the Tableau workspace
How to build a view and different chart types in Tableau
How to create a dashboard in Tableau
How to publish and share a workbook
How to use calculated fields in Tableau
How to use numeric, string, conditional, and analytical expressions/functions in Tableau
This course includes:
6+ hours of video tutorials
33 individual video lectures
Exercise files to practice what you learn
Who this course is for:
Data Analysts
Data Scientists
Anyone looking to turn raw data into meaningful business outcomes using Tableau
Screenshots
Download link:
Só visivel para registados e com resposta ao tópico.Only visible to registered and with a reply to the topic.Links are Interchangeable - No Password - Single Extraction

