Genre: eLearning | MP4 | Video: h264, 1280x720 | Audio: aac, 48000 Hz
Language: English | VTT | Size: 155 MB | Duration: 31 mins
What you'll learn
Design a simple yet concise infographic
Develop your visual graphic through research and sketching
Create an infographic scene and tell a story with visuals
Choose the right colour palette
Learn how to define your goals
Tips to adding style and make your infographic estetically pleasant
Requirements
Pen/Pencil & Paper
Any software you are familiar with: Power Point, Illustrator, Photoshop, InDesign etc
Description
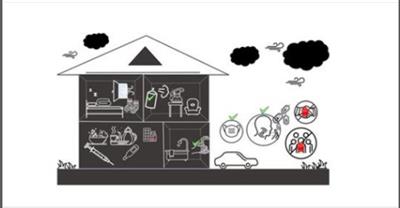
During this course we'll be looking at a real world issue nowadays [the spread of viruses] and learn how to create amazing infographics that display great visual representation, being creative and eye-catching. You will work through understanding your topic, learn how to tell a story, and how to use style and color scheme to maintain a visual hierarchy. This is the perfect opportunity to test yourself with a simple yet beautifully put together infographic.
What you'll learn:
- Develop your visual graphic through research and sketching
- Design a simple yet concise infographic
Your assignment for this course: Create an infographic with at least 10 icons that will convey a message or raise awareness. Use what you learned about how to best represent different kinds of information. Be creative and have fun assembling the elements relevant to the story icons into a big cohesive graphic.
The infographic can be done through any software you are familiar with I will be using Power Point. You can use: Illustrator, Photoshop, InDesign, Excel, Prezi, Tableau, or just pen and paper.
I am mainly working with already made icons from IconFinder in order to create the infographic. I will take you through the research, icon finding, (sketching), layout, electronic development and finally adding style.
Also:
1. Post your project in the QA section with your process so everyone can help each other with their progress and provide constructive criticism.
2. Feel free to post any questions.
Who this course is for:
Anyone who loves to explore infographics design and learn to use style and layout to tell a story.
Students, teachers, entrepreneurs, etc. with any level of knowledge
Anyone who wants to learn how to effectively represent data/information through an infographic
Download link:
Só visivel para registados e com resposta ao tópico.Only visible to registered and with a reply to the topic.Links are Interchangeable - No Password - Single Extraction

 Cantinho Satkeys
