Animated Infographics and Data Visualization Using After Effects
MP4 | Video: AVC 1280x720 | Audio: AAC 44KHz 2ch | Duration: 5.5 Hours | 2.41 GB
Genre: eLearning | Language: English
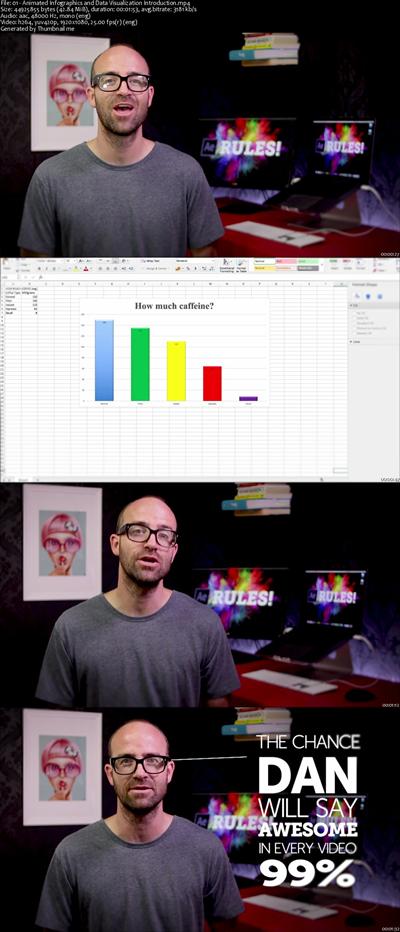
This Animated Infographics and Data Visualization Using After Effects training course is for beginners. Join instructor Daniel Scott as he shows you how to bring boring data to life using Adobe After Effects CC. Animated Infographics and Data Visualization Using After Effects starts with the very basics, taking simple icons and breathing life into them using Adobe After Effects. We'll work through a real life project, connecting Microsoft Excel into After Effects to transform your boring spreadsheet data into approachable visual information. We'll experiment with lighting and cameras. We'll do some fun things with masking - looking at how important sound is in your presentation, all the way through to exporting for Youtube, PowerPoint, and all sorts of social media, including animated GIFs. There are projects for you to complete, so you can practice your skills and use these for your portfolio. There is a cheat sheet, and I've got exercise files so you can play along. I will also save my files as I go through each video so that you can compare yours to mine - handy if something goes wrong. What are you waiting for? Lets get started! Project Files included Length: 5 hrs 37 minutes. Requirements: You will need a copy of Adobe After Effects, Illustrator and Photoshop CC 2017 or above. 90% of the course will be done in After Effects, but a few things are better done in Illustrator and Photoshop. Free trials can be downloaded from Adobe.

Download link:
Só visivel para registados e com resposta ao tópico.Only visible to registered and with a reply to the topic.Links are Interchangeable - No Password - Single Extraction

